The pie chart below shows the distribution of the total federal budget spending for FY 2013.
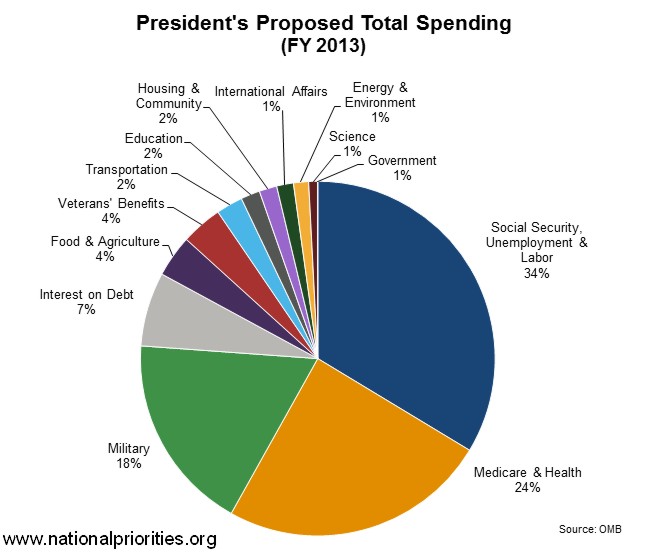
The “Social Security & Unemployment” and “Medicare & Health” take on a major fraction of the federal spending, amounting to about 58% of the total outlays, whereas “Military” spending appears to amount to just 18%. The problem with this representation is that the Social Security & Medicare are parts of the mandatory spending directly financed by the dedicated revenue raised from payroll taxes, as imposed by the Federal Insurance Contributions Act (FICA), not through the Federal income tax and thus represents a different Treasury account.
If we separate the mandatory spending and look only at the discretionary spending component appropriated by Congress on an annual basis and for which all the federal programs compete, a very different picture arises.
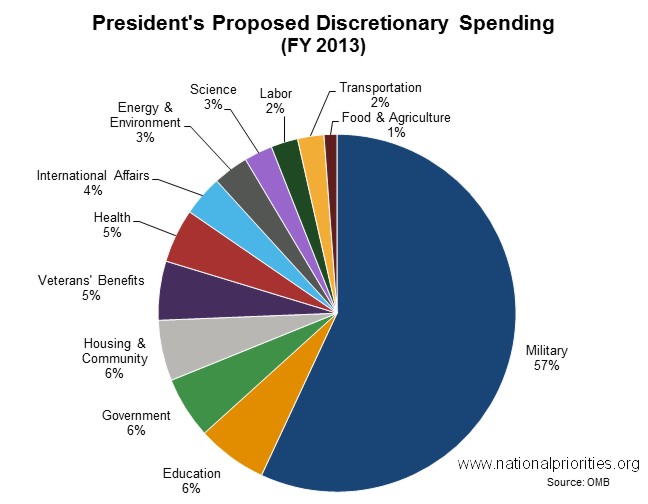
The Military (“National Defense” budget function 050) consumes nearly 57% of the discretionary budget in comparison to Education (6%), Science (3%), Energy & Environment (3%), etc. Military spending has sharply risen since the beginning of the War on Terrorism, from $294b in FY 2000 to $705b in FY 2013 (data from Budget of the United States Government: Historical Tables Fiscal Year 2013, Table 6.1).
Military spending in inflation-adjusted dollars is now greater than at any time since World War II — even greater than during the peak spending years of the Vietnam War, the Korean War, and the Persian Gulf War (figure credit: RandomNonviolence).
A large portion of this spending goes to the military contractors, companies whose profits and viability critically depend on the size of the military budget. Defense contractors actively lobby and donate campaign money to the members of Congress who sit on the Armed Forces and Appropriations Committees which oversee military spending. The table below shows the amounts of federal contracts awarded to the five largest defense contractors, and the corresponding expenses on lobbying and political campaign contributions for 2011.
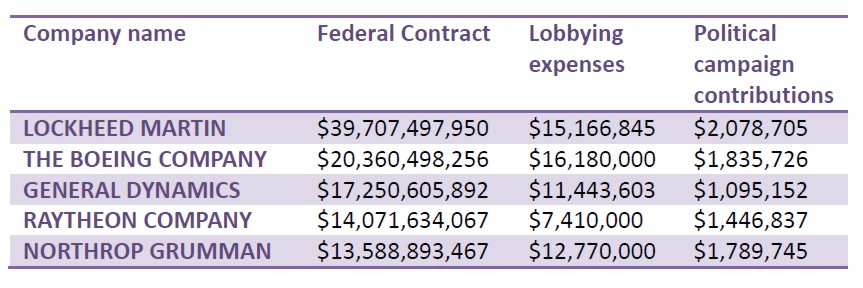
You can see that these companies are having an excellent return on their investment. To be fair we must also mention that defense companies do employ many workers across the country who are reminded by their bosses of potential job losses if spending decreases. Undoubtedly, the Military budget can be reduced at such a rate as to allow for natural job attrition from the defense sector to avoid the defense contractors having to fire their employees, but this is never discussed. Instead we hear that cuts to the Military budget will result in huge job loss for the economy; however, research shows otherwise. The Political Economy Research Institute conducted a study of “The U.S. Employment Effects of Military and Domestic Spending Priorities” concluding that $1 billion spent on domestic priorities will create substantially more jobs within the U.S. economy than would the same $1 billion spent on the military: 1.5 times more in Clean Energy and 2.4 times more in Education. Therefore, spending shifted from the defense to the domestic sectors of the economy will actually create jobs not the other way around. You can watch interview with the institute’s co-director: Military spending: Bang for the Buck?
Similarly, reductions in the Military budget should be accompanied by a natural attrition of military personnel toward a more sustainable, leaner size for the Armed Forces. Veterans for Peace does not support pay cuts or forced lays offs of military personnel in order to balance a federal budget.
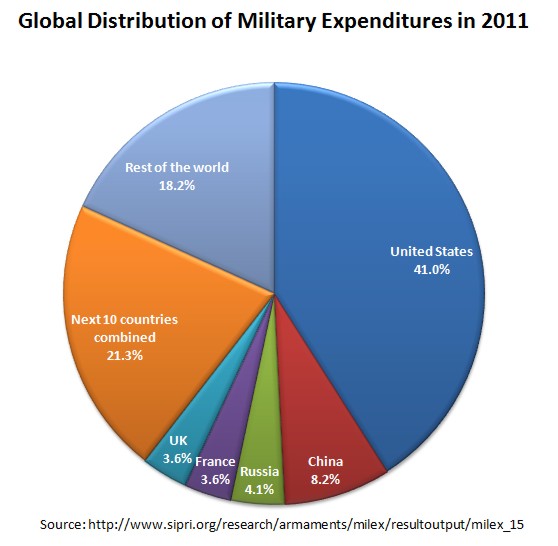
Reduction in the Military budget does not threaten our national security. Even if defense spending were reduced by half, the US would easily remain the world’s strongest military superpower. The figure below shows how the US military spending compares to the rest of the world. The US spends almost 5 times more than China on the military, 10 times more than Russia, and 95 times more than Iran!
And do not expect the DoD to be careful with that money. In 2001 the US Secretary of Defense Donald Rumsfeld admitted that the DoD cannot track $2.3 trillion in transactions, supposedly because of the complexity and the multitude of accounting systems which do not conform with each other. Read Rumsfeld’s entire speech.
The DoD continues on the goose chase after the loose money preparing for its first audit by 2017 amidst the Government Accountability Office’s sobering assessment of the department’s accounting issues.
The defense contracting systems is ripe with fraud and abuse and according to a DoD report hundreds of defense contractors that defrauded the U.S. military received more than $1.1 trillion in Pentagon contracts during the past decade.
Proponents of high military expenditures commonly emphasize that military spending as a percentage of GDP has considerably declined since the end of the WWII as shown in the figure below suggesting that military spending is already at historically low levels.
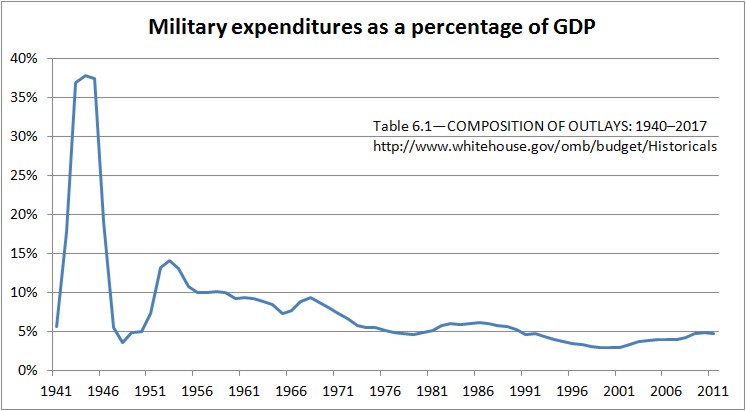
The problem with this argument is that military spending as a percentage of GDP represents the burden such spending puts on the entire economy, but does not indicate the burden military spending places on the taxpayers. The general decline in military spending as a percentage of the GDP is a testament to economic growth, not to a reduction in military appropriations, which have continued to increase since the end of WWII even when adjusted for inflation as was previously shown. The accurate measure of the burden military spending puts on the taxpayer is the percentage of the discretionary budget spent on the military as shown below.
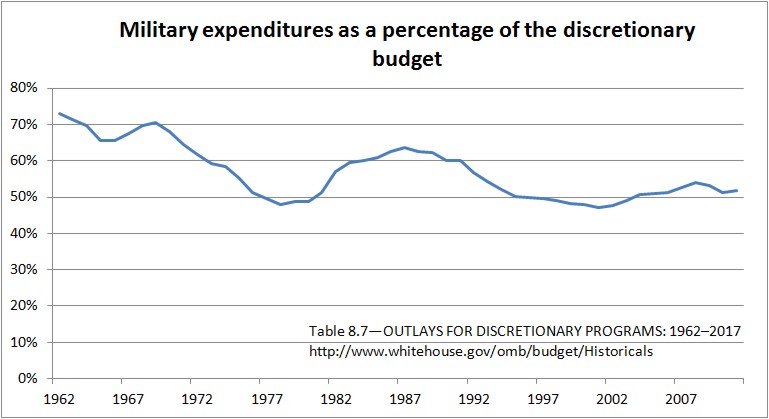
This fraction has changed significantly since the end of the WWII and does not manifest a consistent downward trend. On the contrary, since the beginning of the War on Terrorism the fraction spent on the military is on the rise.
In any case, the US spends more of its GDP on the military than any other major military power as shown below, and far surpasses those nations in spending when looking in absolute amounts.
The Military (“National Defense” budget function 050) consumes nearly 57% of the discretionary budget in comparison to Education (6%), Science (3%), Energy & Environment (3%), etc. Military spending has sharply risen since the beginning of the War on Terrorism, from $294b in FY 2000 to $705b in FY 2013 (data from Budget of the United States Government: Historical Tables Fiscal Year 2013, Table 6.1).
Military spending in inflation-adjusted dollars is now greater than at any time since World War II — even greater than during the peak spending years of the Vietnam War, the Korean War, and the Persian Gulf War (figure credit: RandomNonviolence).
Further reading: